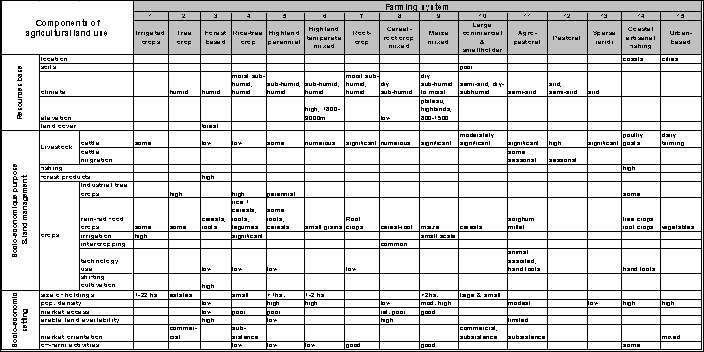
Table 2: Summary of agricultural production systems in Sub Saharan Africa (after Dixon et al, 2001)
DRAFT DOCUMENT FOR REVIEW – DO NOT DISTRIBUTE - last update 14 September 2006
The rapid characterization and mapping of agricultural land-use: A methodological framework approach for the LADA project
Hubert George a and Monica Petri b
a Technical Officer, Land & Plant Nutrition Management Service, FAO
b Consultant on spatial data analyses, Land & Plant Nutrition Management Service, FAO
__________________________________________________________________________________
Abstract
The paper outlines a methodological framework (F-CAM) for the spatial integration of land-use data in a manner that would allow the resulting information base to support land-related interventions targeted at issues such as poverty, hunger, and environmental sustainability. Selecting key determinant parameters from among those used to define land utilization types and regional farming systems as a starting point, relevant data sets are suitably grouped and analysed, using a combination of expert knowledge and simple spatial modelling, to form a spatial information base on land use which can be flexibly queried by end users to support a wide range of land interventions. A pilot study demonstrates the potential usefulness of the framework for preparing a small-scale map of farming systems at using readily-available data. The resulting map could be used in planning local assessments of land degradation as well as in formulating interventions for reducing land degradation. Experiences gained during this national pilot study would be useful in guiding the preparation of consistent global databases on agricultural land use required for the global LADA (Land Degradation in Drylands) project[1].
Keywords: Agricultural land use, farming systems, mapping, characterisation, spatial analysis
__________________________________________________________________________________
1. Introduction
1.1 Need for consistent, comprehensive information on land use
Land-use information[2] is a key input to a wide range of interventions on issues of national to global interest, including land degradation, climate change, food security, poverty and environmental sustainability. However, datasets of sufficient scope on land use (i.e. information covering multiple attributes of land use e.g. land-use purposes, associated land management and socio-economic factors) are generally scarce or outdated, particularly in some developing countries (George and Nachtergaele, 2002). Yet multiple datasets each containing information on one or more of these attribute(s) and commonly prepared by national agencies in fulfilment of their sectoral mandates, are often available within countries.
In instances where national datasets containing multiple land use attributes are available (e.g. land use or farming systems maps), these have been derived using a variety of methodological approaches. The lack of a consistent and sufficiently comprehensive approach leads to (i) difficulties in making inter-country comparisons (ii) difficulties in the preparation of global datasets by compiling results of national-level studies (iii) low appropriateness of existing maps or information bases to meet the information needs of a wide range of interventions.
This paper presents a scale-independent, methodological framework for the consistent spatial integration of agricultural land use from diverse datasets containing different attributes of land-use information in a manner that is useful for planning, targeting and prioritising a wide range of land-related interventions connected with topical issues such as the incidence of food insecurity and poverty, and environmental sustainability.
1.2 Methods of agricultural land-use mapping at national to regional scales
1.2.1 Inferring land use from land cover data
The use of readily available, inexpensive, remote sensing data to map land cover[3] is now well established (FAO, 2005-a). However, the automatic inference of land-use information from land cover is problematic, given the complex[4], area-specific relationship between land cover and land use (Jansen and Di Gregario, 2003; Cihlar and Jansen, 2001; Jansen et al, 1999). In contrast, satellite images have been successfully used as a guide for the manual delimitation of areas of multiple land uses by extension workers familiar with local field conditions (CENATEL, 2004).
Recently, Frolking et al., (2006) explored the use of time-series MODIS imagery to determine seasonal vegetation cycles and subsequently to infer cropping intensity in Vietnam. Difficulties in achieving acceptable distinction between seasonal vegetation and annual crops lead to underestimation of cropping intensities, even though broad identification of different cropping intensity zones appear feasible.
1.2.2 Enhancing land-cover information with census statistics
Kerr and Cihlar (2002) used census statistics as a guide for defining training areas for supervised classification of satellite remote sensing images to yield a national scale map of land use containing information on specific crops and pastures in Canada. Randall and Barson (2001) enhanced the differentiation among broad land-use classes on maps derived from remotely sensed imagery by spatially matching the land-use classes with geocoded census information on commodities and land management practices at farm-holding level in Australia.
Modeling approaches linking sub national crop-production statistics to corresponding land-cover units were used to derive global historical cropland data (Ramankutty and Foley, 1998; Leff et al., 2004; Goldewijk, 2001) as well as to derive land-use maps showing the proportions of major land-use categories (cropland, forests, pasture, other) that are associated with various land-cover units in the US (Hurtt et al, 2001). Models linking cropland areas and census statistics have been used by Frolking et al. (2002) as well as by Qui et al. (2003), for developing maps showing areas of different crop rotations (a land management aspect), in China.
The spatial distribution of agricultural production systems in Russia at 1:4m scale was prepared by linking several attributes - crops, crop rotations, use of fertilizers, types of livestock and animal husbandry, land management (drainage, irrigation, rain fed farming, soil protection, water accumulation) – to land-cover units (Stolbovoi et al, 1997; Stolbovoi and McCallum (2002).
1.2.3 Spatial reallocation of census statistics
Agricultural census statistics are often aggregated by administrative district. These statistics can be re-allocated (disaggregated to their original positions) using a variety of approaches. de Bie (2002) disaggregated district-level crop statistics by applying a set of expert rules based on AEZ suitability of the crop and multi-temporal NDVI imagery (NOAA and SPOT) that was classified to reflect the profiles corresponding to specific crop calenders. You and Wood (2004) developed a statistical ‘cross-entropy’ method for the spatial reallocation of census statistics at 5-minute spatial resolution taking into account several factors, viz. the production system structure, cropping intensity, cropland extent (considered the most important data source), the AEZ suitability for 15 globally important crops and population density. The methodology calculates the statistically ‘likely distribution of the production of individual crops’.
1.2.4 Spatial integration of multiple datasets
In order to support decision making in relation to regional food security in nine African countries[5], data on potential livestock zones in the Sahel (corresponding roughly with a rainfall limit of 300mm) were combined with sub national agricultural census statistics (to derive areas dominated by food crops, cash crops or rice) to map 5 broad agricultural production systems (Centre Régional Agrhymet, 2006).
Using expert knowledge and iterative spatial analysis of several distinguishing characteristics (including livelihood sources, the natural resources base and socio-economic factors, Dixon et al. (2001) developed small-scale global maps of farming systems (i.e. areas of similar resource base, enterprise patterns & household livelihood and constraints). The main purpose of the study was to help identify and target regional investment strategies for alleviating poverty. Mohamed et al (2000) classified and mapped farms in Iran based on four socio-economic criteria (viz. institutional similarity, technological similarity, production efficiency, and location proximity) and subsequently combined this information with biophysical data to yield integrated ‘farm-type land units’ that are useful for land-use planning and policy analysis.
Seré and Steinfeld (1996) developed a quantitative classification of global agricultural production systems with a focus on livestock. The classification scheme takes into consideration several factors, including: integration of livestock with crops, relationship to land, agro-ecological zone, intensity of production, and type of product. Andriesse (1998) describes a methodology for the mapping and characterisation of in-land valley agro-ecosystems in West Africa. For reconnaissance scales, the criteria used for characterization included precipitation, length of humid period, landform, lithology, drainage density, major upland soils, major land use, and population density.
In order to facilitate multi-disciplinary land evaluation and land-use planning, Sombroek (1993) proposed a relatively-complex landscape-based framework for land characterization at various scales, which requires taking into account simultaneously both horizontal and vertical land qualities (covering the atmosphere, land cover, land surface, soil profile and the substratum) in defining land units.
Descheemaeker et al (2001) mapped 37 different farming system types in Syria on the basis of five criteria (viz. cropping systems, livestock, irrigation, spatial organisation and socio-economics) and assuming a coincidence of farming systems and land cover unit boundaries. The main purpose of the study was to provide a decision making tool facilitating the development and transfer of technologies to local farmers, identification of problem areas and topics requiring agricultural research. Tappan et al (2004) defined 13 broad eco-regions for Senegal based on biophysical (climate, geology, hydrology, soils, vegetation) and human management (settlement pattern, land use) criteria as a basis for developing a sampling strategy for assessment of long-term changes in land cover and land use.
Johnson et al. (2004) describe comprehensive national knowledge support systems, including economic models, which help to identify investment options for promoting agricultural growth and rural development. ‘Development domains’, areas representing unique combinations of key factors (e.g. land use, farming practices and income sources) that influence the type of options available at the community level, were used to disaggregate the range of rural livelihood options. In a report commissioned by FAO, Dixon and Ponce-Hernandez (2005) made a comprehensive review of farming systems, identified several ‘determining’ and ‘modifying’ parameters useful for characterizing farming systems and carried out exploratory mapping of farming-systems at national level. The spatial data integration aspects of their approach were further developed by George and Franceschini (2005).
1.2.5 Conclusions drawn from previous studies
A variety of schemes for land-use characterization to suit various planning objectives are possible. Each scheme has it limits. Satellite remote sensing alone currently offers limited possibilities for routinely providing the comprehensive agricultural land-use information, including important land-management aspects (Table 1). Land-management information is generally rare and when available is usually aggregated over large geographic regions, thereby diminishing their suitability for land characterisation. Novel methods for extracting land-management information from remote-sensing imagery are still under development. Land cover is an important but not the only major determinant of land use. Thus, assuming coincidence of land-cover and land-use units may not be appropriate in many instances.
To be considered rapid and pragmatic for land-use mapping at country as well as global levels must be based on data that are easily available. In addition, the scheme must be adequately structured to facilitate comparisons of results obtained from different geographic zones. Thus a structured ‘framework’ approach which places emphasis on the types of information is preferred to one, less flexible, which stipulates specific datasets to use.
The approach proposed in the current study is to ‘integrate’ remote-sensing derived data with other complementary land-use data sets. Two questions which then logically arise are, firstly, ‘What key datasets would meet the information requirements for a broad range of land interventions?’ and, secondly, ‘How best to spatially integrate the key datasets that are available?’ given their inherent variability (e.g. data type, spatial detail, update frequency, scope of content, etc.). These questions are addressed in the framework for spatial data integration discussed below.
2.1 What core datasets are needed to characterize agricultural land use?
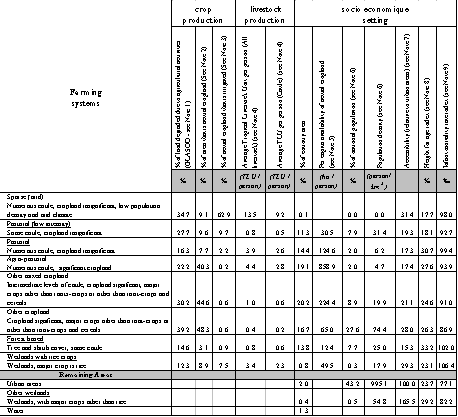
Suggestions of relevant determinant parameters for characterizing agricultural land use are provided from studies on land evaluation for agriculture - for which land utilization types[6] are defined (FAO, 1996) - and from studies on the mapping of farming systems at regional to global scales using expert opinion supported by limited spatial analysis (Dixon et al., 2001). The parameters used in these studies (see Table below), which we propose should be adopted as the framework for compiling a core information base on agricultural land use, fall logically into 3 major classes or components.
i. The resources base[7] (What are the key biophysical factors that determine the range of potential land uses?)
ii. Land uses or enterprise (For what purpose & How is the resources base actually being used? i.e. what are the current land-use options?)[8]
iii. Socio-economic setting (What prevailing socio-economic conditions exert the strongest influences on the choice of potential and actual land-use and land-management options?)
|
Major components of |
Typical data sets or descriptions | |
| Resources base |
water resources, climate, terrain, location, soils, forests, pastures, wildlife, .. | |
|
Land-use purpose & management |
products & services |
rain fed/irrigated field crops; cropping patterns; tree crops; livestock; fishing; .. |
| management |
manual, hand tools, animal traction, mechanization | |
|
traditional/ improved cultivars; fertilizers; pesticides; disease control; fallow; conservation measures; irrigation (see also Table 1) | ||
|
Socio-economic setting |
labour intensity |
low, medium, high |
|
capital intensity |
low, medium, high | |
|
market orientation |
subsistence/ commercial | |
|
farm size & scale/ land tenure |
small & fragmented, large & consolidated | |
| income level |
low, medium, high | |
| infrastructure |
low to high access to markets; advisory services | |
|
population density |
low, moderate to high | |
It is acknowledged that while data for some relevant parameters appearing in the above table are collected fairly regularly during many country-wide surveys (e.g. agricultural census), data for other parameters are often collected infrequently and when available, often relate to areas of small geographic extent, thereby limiting their usefulness for country-wide analyses. Data availability and ease of data access for a given study area (whether local, national or global) are therefore important considerations in any eventual choice of parameters for land-use characterisation. Depending on data availability, indirect rather than direct indicators of land use may have to be used.
A common requirement in many land-use planning activities is information on spatial variations of selected land/ land-use characteristics in order to guide the geographic targeting and subsequent tailoring of interventions. We propose below, for each of the 3 major components of agricultural land-use, some key datasets that are likely to influence most the character of each component. Furthermore, where not already well described in the literature, we outline suggested procedures for the pre-processing of these datasets.
2.1.1 Resources base
The major objective in defining the resources base is to select biophysical and landscape datasets that are determinant (i.e. having the greatest influence on) the potential range of land use options. Later, these datasets would be spatially overlaid to define map units within which the resources base are similar.
Agro-ecological zoning (AEZ) provides a standardized framework for characterizing 3 major resources relevant to agricultural production, viz. the prevailing climate (temperature, water and solar radiation), soil (e.g. texture, drainage, depth, stoniness, ..) and terrain conditions (e.g. slope, aspect, configuration, micro-relief) (Fischer et al., 2002; FAO, 1996). The methodology identifies the suitability of specified land uses under assumed levels of inputs and management conditions and has been successfully applied to, among others, rain-fed agriculture (FAO, 1983), irrigated agriculture (FAO, 1985), extensive grazing (FAO, 1991) and forestry (FAO, 1984). In the absence of sufficiently detailed AEZ data, one may chose other closely related biophysical data layers (e.g. soils, soils constraints, length of growing period, terrain data, etc), as input for defining areas of similar resources base. In order to facilitate eventually queries of the data base by non specialists, it could be useful to reclassify or simplify certain data layers (e.g. the reclassification of soil types in terms of their suitability for agriculture, as for the specific case of Senegal – generally not valid elsewhere – in the table below. -- F. Nachtergaele – private communication, 2006).
| Very suitable |
Calcic Cambisols and Eutric Regosols; Dystric Nitosols; Eutric Fluvisols |
|
Suitable |
Arenosols; Dystric Regosols; Ferric Luvisols; Gleysols and Gleyic Luvisols; Vertisols and Vertic Cambisols |
| Not suitable |
Lithosols; Solonchaks and Solonetz; Thionic Fluvisols |
The presence of certain land cover types is an essential prerequisite for distinguishing some livelihoods (e.g. shifting cultivation in forest-based farming systems; also, the production of industrial tree crops, such as cocoa, coffee, oil palm and rubber, in tree-crop farming systems in sub-Saharan Africa). The LCCS system provides a standardized approach for the characterisation of land cover (FAO, 2005-a).
Additional relevant data on key local production conditions should be included (e.g. data on groundwater availability should be included in areas, such as drylands, where access to this resource constitutes a major influencing factor on land use.
Agricultural statistics (e.g. production, area harvested/cultivated, level of mechanisation, livestock, etc.) provide insights of the agricultural character of a given area. These data, usually aggregated by administrative district, can be used to prepare maps showing the spatial distribution of different crop or crop-group combinations. For determining crop-group combinations, each crop is assigned to a major crop ‘commodity’ group[9]. The relative contribution made by each crop group to the total harvested area for each administrative unit is then calculated. In a final step, the most significant crop group(s) accounting for at least 70% percent of the total harvested area is used to define a unique label for each administrative district. To be included in the label, a crop group must contribute at least 20% of the total harvested area (this further limits the selection to the most significant crop groups). The procedure for crop combinations is similar except that crops are treated individually (i.e. not assigned to a group).
The statistics on livestock are used to calculate an indicator, Tropical Livestock Unit per capita, for each reporting administrative district.
Three principal parameters were selected to character socio-economic setting. (i) Land availability,(ii) population density and (iii) access to markets (or infrastructure). These are key socio-economic factors that together, are determinant in the choice among possible land use options and land management practices (Smith, 1995; Enters, 2000). Potentially useful indicators of land availability are ‘cropland area per capita’ or ‘the average size of area cultivated by each household’. Various cost-distance modelling techniques for mapping access to markets based on road networks and geomorphologic factors are described in the literature (see CIAT, 2006).
2.1.4 Supplementary information
Supplementary and ancillary data should be included in the information base, as needed, in order to widen the range of potential interventions that could be supported. For example, additional socio-economic factors that may be used depending on the spatial scale and relevancy to planned interventions include: land tenure, land transfer practices, plot boundaries, plot size, property management, orientation of production, intensity of production; prices/ subsidies, and access to credit. Care should be taken in selecting additional socio-economic factors that are the most relevant to decision support for the end-user application. The selection of supplementary indicators relative to the issue of land degradation can, for example, be selected using the Pressure-State-Response causal framework[10].
2.2 How best to spatially integrate the key datasets that are available?
2.2.1 General
In practice, a research of potentially useful datasets from both local and international sources should first be carried out followed by an evaluation of the appropriateness of each dataset, in relation to the geographic area of interest (local, country, global). Available datasets may present a heterogeneous mixture of spatial detail (i.e. level of statistical aggregation) and completeness. Thus, in practice, only those with good spatial detail (relative to the scale of study) and the most relevant information content should be retained for analysis. For any given component, the use of multiple datasets that are very strongly correlated spatially should be avoided since this would contribute little to highlighting spatial variations.
A simplified schematic of the F-CAM spatial data “integration” procedure is shown in Figure 1. Available data sets corresponding to each of the 3 components (Resource base, Land use purpose and management, Socio-economic setting) are separately pre-processed followed by their integration in the spatial database.
2.2.2 The land-use information base
The datasets selected by the user to determine areas of similar resources base (for instance, land cover, LGP, and landform) are spatially overlaid to yield a grid map consisting of various combinations of the input layers[11]. These units reflect the biophysical and landscape factors which together exert a strong influence on land-use options. Actual land uses within any given resources-base unit are expected to be reasonably similar[12]. These resources base units are therefore used conceptually as ‘mapping units’ to which are attached as ‘attributes’ the characteristics for the remaining 2 land-use components (viz. Land use purpose and management, and socio-economic setting).
Datasets corresponding to these 2 components are usually of varied origins and often present a heterogeneous mixture of characteristics. While there are methodologies (“manual interpretation” as well as “automatic”) for proportionally attributing class characteristics during multiple overlay operations of such heterogeneous data sets (George and Franceschini, 2005), it is reasoned that the use of such methodologies would be inconsistent with the present objective of developing an approach to characterisation that is simultaneously rapid as well as easily replicated at regional to continental scales. Instead, a simple overlay of datasets is preferred. Together, the datasets corresponding to the 3 components of agricultural land use constitute the information base which can be flexibly queried to yield information products suitable for guiding a wide range of interventions.
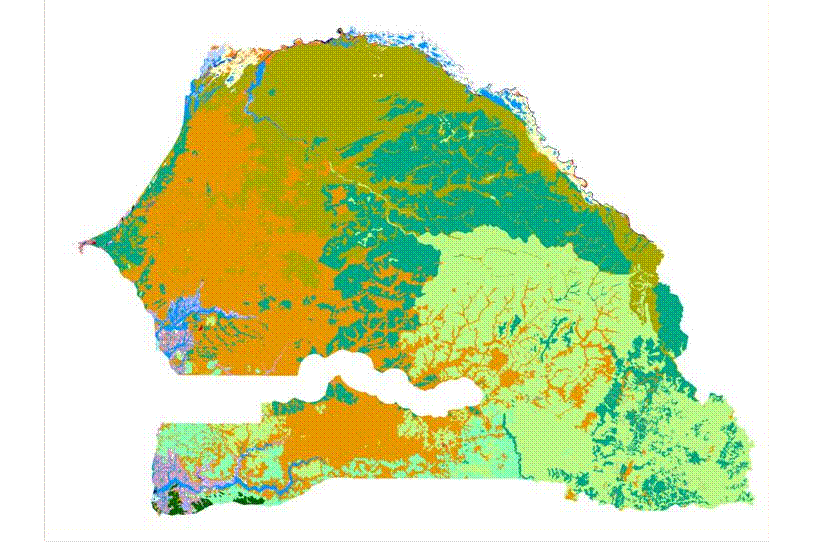
3. Pilot study: Map of farming systems in Senegal
Fairly complex queries could be addressed to the land-use information base. An example of such a query is the decision tree classifier for mapping farming systems (Fig. 2) based on primarily on the descriptions of regional farming systems presented in Dixon et al (2001) for sub-Saharan Africa (Table 2). The decision tree classifier was applied to a land-use information database developed (at 30 arc secs ~1 km) for Senegal, in order to map farming systems at a small scale. The various information layers and related processing are described in the following sections.
3.1 Resources base units
|
New classes |
Original | |
| 1 |
Tree cover |
Tree Cover, broadleaved, evergreen |
|
Tree Cover, broadleaved, deciduous, open | ||
|
Mosaic: Tree cover / Other natural vegetation | ||
| 2 |
Regularly flooded vegetation |
Tree Cover, regularly flooded, saline, (daily variation) |
|
Regularly flooded shrub and/or herbaceous cover | ||
| 3 |
Herbaceous & sparse shrub |
Herbaceous Cover, closed-open |
|
Sparse Herbaceous or sparse shrub cover | ||
| 4 |
Shrub |
Shrub Cover, closed-open, deciduous (± sparse tree layer) |
| 5 |
Cultivated |
Cultivated and managed areas |
| 6 |
Mixed cropland |
Mosaic: Cropland / Tree Cover |
|
Mosaic: Cropland / Other natural vegetation | ||
Length of growing period, LCP: The software NewLocClim (FAO, 2006-c) and its database of agro-climatic observations covering the period 1961-1990, were used to prepare an image layer showing the length of growing period (i.e. the number of days where rain exceeds more than half evapotranspiration), with the following class intervals: arid (0-29 days); dry semi-arid (30-119 days); moist semi-arid (120-179 days); moist sub-humid (180-269 days); humid (≥ 270 days).
A map of the resulting resource-base units (from overlay of the abovementioned data layers – land cover, LGP, and landform) is presented in Figure 3. A soils map of Senegal was examined to evaluate its value as a key discriminating factor of land uses. No strong spatial correlation between patterns on the soils map and land-use patterns on Landsat imagery was evident. It was concluded that soils are, in general, not a major determinant factor in explaining land use under local conditions. This conclusion is consistent with the logic that many soil constraints can be overcome with appropriate land management (F. Nachtergaele, personal communication, 2006; Khouma, 2002). Soil information was therefore not used in defining the resources base. However, given its relevance to many agricultural applications, data on soils are included as supplementary information within the information base.
Crops & management: Statistics on crops (available from Agro-MAPS, George et al., 2003) and on mechanisation from the 1998/99 national agricultural census were used to prepare maps showing the spatial distribution by department of (i) different crop-group combinations (ii) level of mechanisation. The AQUASTAT ‘map’ on irrigation (Siebert et al, 2005), depict the percentage of areas that are ‘equipped’ for irrigation as a raster image (5 arc minutes). To facilitate spatial analysis, this was resampled to a 30 arc seconds grid and reclassified to create a mask showing areas where irrigation is present.
Livestock & management: Statistics from the 2004 livestock census on livestock numbers (cattle, sheep, goats) by administrative departments were used to create a map showing the spatial distribution of TLU/per rural capita.
3.3 Socio-economic conditions
Rural population density: Data were extracted from FAO’s Poverty Mapping Urban Rural Database that was derived from LANDSCAN (FAO, 2005-b).
Availability of land: Two indicators from the 1998/99 agricultural census were used (i) average size of area cultivated by household (ii) number of households who are landowners.
Infrastructure/market access: Data on the network of road and railway lines were used as input to cost-distance modelling to create a raster data layer showing relative access to markets. The model calculates an accumulated cost to each location from the nearest population centre of more than 25000 inhabitants –based on a user-selectable ‘costing’ scheme. The relative ‘movement’ costs selected for the layer defining the type of road present were as follows: tracks (5); major tracks (4), paved roads (1), railroads (1) no roads (10). Costs associated with movement across different degrees of slope were 0-10% (1), 10-20% (2), 20-30% (3), >30% (5).
3.4 Supplementary information
The following selected supplementary datasets were added – indicators of poverty (height for age -- FAO (2006-b); infant mortality -- CIESEN, 2005); indicators of land degradation from the GLASOD survey (Oldeman et al, 1991).
3.4 Derivation of ‘farming systems’ from the land-use information base
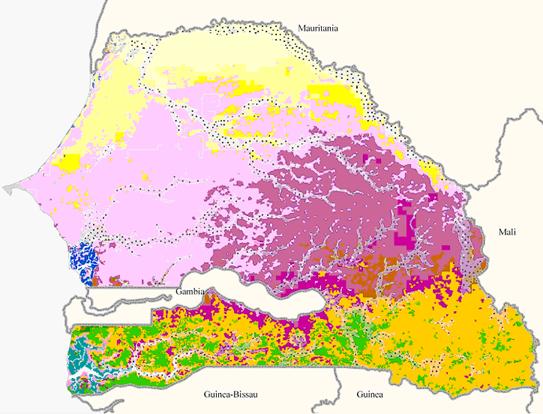
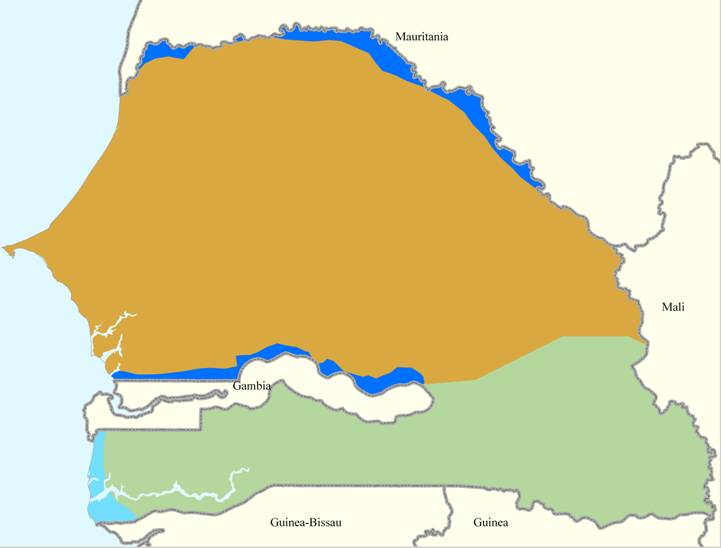
The decision tree shown in Figure 2 was applied to the resulting land-use information base for Senegal in order to create a map of farming systems. Results are shown in Figure 4-A. The corresponding map from the Dixon et al (2001) study is also shown in Figure 4-B for comparison. Also shown, are maps of earlier national-level studies (Figure 4-C to 4-E). In general, the map produced by querying the land-use information base provides more significantly different classes (8 versus 4) and more spatial detail than the 2001 study Detailed descriptions of each class are included in Table 3. It should be noted, however, that the present approach can only yield output classes that are based on the characteristics of the input data layers. Thus, for example, the approach does not readily allow the delimitation of coastal artisanal fishing systems. If desired, this information could be added to the map of ‘land-based’ farming systems produced by this study by relatively simple techniques provided that the required information is available (e.g. statistics on household activities, maps on surface hydrology, and management aspects[13]).
The information base could be further queried in order to provide summary statistics for each farming system that would be of value in guiding interventions related to each system (see Table 2), such as “Which production systems ---
· are most subject to land degradation
· are good targets for agricultural development
· are characterised by high levels of poverty, high population and high risk of land degradation
· have high potential for conversion into other systems in order to reduce the overall impact of land degradation
The map of agricultural production systems could be used as a ‘stratification’ layer in support of several activities envisaged for LADA, e.g.
· Facilitate comparison of results from local and global studies (e.g. extrapolations, exploration of the probable causes of land-degradation hotspots identified by small-scale “global” studies)
· Facilitate the selection of test sites, sufficiently different in characteristics, for the evaluation or the application of LADA methodologies.
· Tailor remedial interventions against land degradation in relation to current livelihoods
5. Concluding remarks
There is a general lack of agricultural land-use maps of sufficient information content to support the decision making needs of many land-related interventions, especially at regional and global scales. This gap can be filled using the framework (F-CAM) approach detailed in this paper. F-CAM represents a rapid, structured and replicable approach for defining the content, organisation and compilation of a spatial data database on agriculture land use at small scales, from a variety of existing input datasets on various attributes of land use.
The approach places emphasis on the types of information to collect taking into account 3 major components of agricultural land use (namely, the resources base, the socio economic purpose & management, and the socio-economic setting).
The characteristics of the input layers bear a strong influence on the appearance and as well as validity of output map classes. Hence, expert knowledge should be use in the selection of the various layers of information to be used following the F-CAM approach.
The pilot study for Senegal demonstrates the potential utility of the F-CAM framework for mapping and characterising farming systems in terms that are useful for planning a range of interventions. The validation of the results obtained and the further development of the methodology in cooperation with local specialists is planned in the near future. In particular, the use of a typology of farming systems better adapted to local conditions as well as access to other data layers not available at the time of preparation of the present study would serve to improve the results.
Acknowledgements
We gratefully acknowledge the valuable inputs and comments provided by Jacques Antoine and Freddy Nachtergaele of the Land and Water Development Division, FAO, on an initial draft of this paper.
References
Andriesse, W. 1998. Mapping and characterization of inland valley agro-ecosystems: The case of West Africa.; in Wetland characterization and classification for sustainable agricultural development. FAO. URL: http://www.fao.org/DOCREP/003/X6611E/x6611e00.htm#TopOfPage. Last accessed 28 July 2006.
CENATEL (2004). Réalisation de cartes d’utilisation des terres dans les régions de Bori et de Bétérou – Rapport Final. Centre National de Télédétection et de Surveillance du Couvert Forestier, Ministère de l’agriculture, de l’élevage et de la pêche, Cotonou, Bénin. 60p.
Centre Régional Agrhymet. 2006. Projet Alèrte précoce et prevision des productions agricoles – AP3A. URL: http://www.ibimet.cnr.it/Case/ap3a/ Last accessed 28 February 2006.
CIAT. 2006. A simple and flexible tool for deriving accessibility models. URL: http://www.ciat.cgiar.org/access/index.htm Last accessed 24 July 2006
CIESIN. 2005. Global sub national infant mortality rates dataset. Center for International Earth Science Information Network (CIESIN), Columbia University Palisades, NY, USA. URL: http://www.ciesin.columbia.edu/povmap/ds_global.html. Last accessed 14 July 2006.
Cihlar, J. and Jansen, L.J.M. 2001. From land cover to land use: A methodology for efficient land use mapping over large areas. Professional Geographer, 53(2), p.275-289.
Cormier, C. Gueye, A. Lericollais, S.M. Seck, 2000. La costruction de l’espace sénégalais depuis l’indipendance, 1960-2000. http://www.cartographie.ird.fr/SenegalFIG/ Last accessed 28 July 2006.
CSE. (2003). L’utilisation des terres agricoles au Sénégal -Rapport Final. Préparé pour la FAO, non- publié. 51p.
de Bie, C.A.J.M. 2002. Novel approaches to use RS-products for mapping and studying agricultural land use systems. In: ISPRS 2002 TC-VII : Commission VII, Working Group VII-2.1 on sustainable agriculture : International symposium on resource and environmental monitoring : 3-6 December 2002, Hyderabad. 9p. URL: http://www.itc.nl/library/Papers/0019.pdf Last accessed 27 March 2006.
Descheemaeker, K., N. Cool, E. De Pauw and J. Deckers. 2001. Farming systems in Syria: Towards a methodology for characterising and mapping farming systems. Journal of the International Land Use Society. 5.2:101-118.
Dixon, R. and Ponce-Hernandez. 2005. National-Level Land Use/Farming Systems Characterization. Unpublished commissioned report to FAO. 132p. URL: ftp://ext-ftp.fao.org/AG/agl/agll/TrentUniversityStudy2005/ Last accessed 28 July 2006.
Dixon, J, Gulliver, Gibbon, D. 2001. Farming Systems and Poverty - Improving farmers' livelihoods in a changing world. FAO and World Bank, Rome and Washington DC. 412p.
Enters, T. 2000. Guidelines for socioeconomic site characterization. Management of soil erosion consortium - IBSRAM, Bangkok. Unpublished report, 12 pages. URL. http://www.iwmi.cgiar.org/
FAO, 2006-a. FAO commodity groups. URL: http://faostat.fao.org/faostat/faoinfo/Economic/faodef/faodefe.htm#COMG Last accessed 3 March 2006.
FAO, 2006-b. Chronic Undernutrition among Children. URL: http://www.povertymap.net/mapsgraphics/graphics/undernutrition_en.cfm Last accessed 27 July 2006.
FAO, 2006-c. NewLocClim. URL: ftp://ext-ftp.fao.org/SD/SDR/Agromet/New_LocClim/
Local Climate Estimator software and global climate database. Last accessed 14 September 2006.
FAO. 2005-a. Land Cover Classification System (LCCS): Classification concepts and user manual. Software version 2 (revised by A. Di Gregorio). 190p.
FAO, 2005-b. Mapping global urban and rural population distribution. Environmental and natural resources working paper 24, 88p.
FAO. 1999. Terminology for integrated resources planning and management.69p.
FAO, 1996. Agro-ecological zoning guidelines. FAO Soils Bulletin 73.
FAO, 1991. Guidelines: land evaluation for extensive grazing. FAO Soils Bulletin 58
FAO, 1985. Guidelines: Land evaluation for irrigated agriculture, FAO Soils Bulletin 55
FAO, 1984. Land evaluation for forestry. FAO Forestry Paper 48
FAO, 1983. Guidelines: Land evaluation for rainfed agriculture, FAO Soils Bulletin 52
Fischer, G. van Velthuizen, Shah, M., and F. Nachtergaele. 2002. Global agro-ecological assessment for agriculture in the 21st century. IIASA/FAO. 119p.
Frolking, S., Frolking, T., Xiangming Xiao, Boles, S., Milliman, T. 2006. A generalized methodology for incorporating remote sensing data into mapping agricultural land use and management at sub-national scales, including a case study of combining census data and remote sensing data to map cropping intensity in Vietnam. Unpublished Commissioned FAO study.
Frolking S, J. Qiu, S. Boles, X. Xiao, J. Liu, Y. Zhuang, C. Li, X. Qin. 2002. Combining remote sensing and ground census data to develop new maps of the distribution of rice agriculture in China. Global Biogeochemical Cycles, 16(4), 1091, doi:10.1029/2001GB001425
George, H. and Franceschini, G. 2005. f-CAM – A framework for the characterisation and mapping of agricultural land use at sub national scales using pre-existing data sets. Unpublished report. URL: ftp://ext-ftp.fao.org/AG/agl/agll/fcam/. Last accessed 28 July 2006.
George, H. and F. Nachtergaele. 2002. Global land use databases. Chapter 16 in "Global Environmental Databases – Present Situation; Future Directions, Volume 2. Ryutaro Tateishi and David Hastings (editors), ISPRS, Geocarto International, 55-67.
George, H., Nachtergaele, F. and P.Koohafkan. 2003. Agro-MAPS: A global spatial database of sub-national agricultural land-use statistics. Proceedings of Africa-GIS 2003, Dakar, Senegal. 16p. URL: http://www.fao.org/landandwater/agll/agromaps/interactive/index.jsp (last accessed 27 March 2006)
GLCN. 2006. Global Land cover network. URL: http://www.glcn.org/ (last accessed 17 March 2006).
Goldewijk, K. 2001. Estimating global land use change over the past 300 years: the HYDE database. Global Biogeochemical Cycles, Vol 15(2): 417-434 URL: http://www.mnp.nl/hyde/download/ (last accessed 27 March 2006)
Hurtt G.C, L. Rosentrater, S. Frolking, B. Moore. 2001. Linking remote-sensing estimates of land cover and census statistics on land use to produce maps of land use of the conterminous United States. Global Biogeochemical Cycles.15:673-685.
Jansen, L.J.M. and A. Di Gregario. 2003. Land-use data collection using the ‘land cover classification system’: results from a case study in Kenya. Land Use Policy, 20, 131-148.
Jansen, L.J.M., Di Gregario, A. and J.S. Latham. 1999. Derivation of land-use classes from a remotely sensed data derived land cover map: Results from a case study in Lebanon; unpublished manuscript, FAO, Rome.
Jenness, J. 2006. Topographic position index (tpi-jen.avx) extension for ArcView 3.x. Jenness Enterprises. URL: http://www.jennessent.com/arcview/tpi.htm. Last accessed 25 April 2006.
Johnson, M., Resnick, D., Bolwig, C., Chamberlin, J., Liangzhi You., Wood, S., Hazel, P. 2004. Strategic analysis and knowledge support systems for rural development strategies in sub Saharan Africa. DSCG Discussion Paper No. 14., International Food Policy Research Institute. 69p. URL: http://www.ifpri.org/divs/dsgd/dp/papers/dsgdp14.pdf. Last accessed 28 February 2006.
Joint Research Centre. 2006. URL: http://www-gvm.jrc.it/glc2000/ (last accessed 16 March 2006).
Kerr, J.T. and J. Cihlar. 2002. Land use and cover with intensity of agriculture for Canada from satellite and census data. unpublished manuscript. Canada Centre for Remote Sensing. 31p.
Khouma, M. 2002. Commentaire à la conférence électronique sur le projet LADA ‘Data sets, indicators, and methods to assess land degradation in drylands’, World Soil Resources Report, 100. 109p.
LADA. 2006. Land degradation assessment in drylands. URL http://lada.virtualcentre.org/pagedisplay/display.asp Last accessed 7 September 2006.
LandScan, 2002. Worldwide population database. URL http://www.ornl.gov/sci/landscan/. Last accessed 27 July 2006.
Leff, B., Ramankutty, N., and J. Foley. 2004. Geographic distribution of major crops across the world. Global biogeochemical cycles, 18, GB1009.
Mohamed, A.A, Sharifi, M.A. and H. van Keulen. 2000. An integrated agro-economic and agro-ecological methodology for land use planning and policy analysis. International Journal of Applied Earth Observation and Geoinformation, volume 2, issue1, 87-103.
Oldeman, L.R., Hakkeling, R. & Sombroek, W.G. S. 1991. A global assessment of the status of human induced soil degradation. An explanatory note. ISRIC/UNEP, Wageningen, Nairobi.
Qiu J, H. Tang, S. Frolking, S. Boles, C. Li, X. Xiao, J. Liu, Y. Zhuang, X. Qin. 2003. Mapping single-, double-, and triple-crop agriculture in China at 0.5°x0.5° by combining county-scale census data with a remote sensing-derived land cover map. Geocarto International, 18:3-13
Ramankutty, N. and J.A. Foley. 1998. Characterizing patterns of global land use: An analysis of global croplands data. Global biogeochemical cycles, volume 12, 4, 667-685.
Randall, L. and M. Barson. 2001. Mapping agricultural commodities and land management practices from geocoded agricultural census data; unpublished report, National Land and Water Resources Audit, Commonwealth of Australia, 32p.
Seré, C. and H. Steinfeld. 1996. World livestock production systems. Animal Production and Health Paper 127. FAO. URL http://www.virtualcentre.org/en/dec/toolbox/Paper127/cover1.htm Last accessed 24 July 2006.
Siebert, S., Döll, P., Feick, S., and J. Hoogeveen, 2005. Global map of irrigated areas version 3.0, Johann Wolfgang Goethe University, Frankfurt am Main, Germany / Food and Agriculture Organization of the United Nations, Rome, Italy
Smith, J. 1995. Socio-economic characterization of environments and technologies. International Institute of Tropical Agriculture, IITA Research Guide 50.
Sombroek, W. 1993. Development of a framework for holistic land characterization and development at different scales; in Land and water integration and river basin management. FAO Land and Water Bulletin, 1. URL: http://www.fao.org/docrep/V5400E/v5400e00.htm#Contents
Stolbovoi V., and I. McCallum. 2002. CD-ROM "Land Resources of Russia", International Institute for Applied Systems Analysis and the Russian Academy of Science, Laxenburg, Austria. URL: http://www.iiasa.ac.at/Research/FOR/russia_cd/agr.htm (last accessed 4 September 2006)
Stolbovoi V., G. Fischer, B. Sheremet and S. Rojkova (Kravets). 1997. The IIASA/LUC project georeferenced database for the former USSR. Volume 6: Agricultural regionalization. 22p. URL: http://www.iiasa.ac.at/Publications/Documents/IR-97-088.pdf (last accessed 4 September 2006)
Tappan, G. G., Sall, M., Wood, E. C., & Cushing, M. 2004: Ecoregions and land cover trends in Senegal. Journal of Arid Environments 59:427-462.
United Nations, 2006. World Population Prospects: The 2004 revision population database URL: http://esa.un.org/unpp/p2k0data.asp (last accessed 16 March 2006)
USGS, 2006-a. SRTM – Shuttle Radar Topography Mission. URL: http://srtm.usgs.gov/ (last accessed 17 March 2006)
USGS, 2006-b. GTOP30. URL: http://edc.usgs.gov/products/elevation/gtopo30/gtopo30.html (last accessed 17 March 2006).
You, L. and S. Wood. 2004. Assessing the spatial distribution of crop production using a cross-entropy method. Discussion Paper, number 126, 32p. URL: http://www.ifpri.org/divs/eptd/dp/papers/eptdp126.pdf (last accessed 27 March 2006).
Young, A. 1998. Land resources. Now and for the future. Cambridge University Press, 319 p.
Table 1: Selected major land management activities related to crop, livestock and forestry production of potential use in guiding remedial interventions in matters related to food security and environmental sustainability, among others.
|
Crops |
Crop management Crop production intensity -multiple cropping, use of improved cultivars, crop rotation/ shifting cultivation, fallow |
|
Prevalence of pests, disease, weeds -use of pesticides, fungicides, weed control, biological control | |
|
Agro-climatic suitability -use of controlled environments | |
|
Soils management Chemical constraints -use of fertilizer (mineral/organic and application rates, other soil amendments) | |
|
Physical constraints -tillage; terrain/slope modifications | |
|
Biological constraints -incorporation of crop residues; -planting of cover crops | |
|
Water management Water stress/deficiency -use of irrigation (manual/ equipped) | |
|
Excess moisture/water hazard -drainage management | |
|
Water run-off - planting of vegetative cover; - placement of mulch | |
|
Water treatment/ use management | |
|
Livestock |
open grazing; fenced pastures; improved pastures, stall fed; share of local breeds |
|
access to water resources | |
|
share of local/external feed | |
|
access to credit; extension; veterinary; drugs & vaccinations | |
|
Forestry |
Harvest technology: manual; chainsaw; mechanized |
|
Silviculture: Crown thinning; selective cutting; freeing from threatening trees, enrichment; sanitary cuttings; .... | |
|
Disturbances: Protected area; exploited with or without management plans; rate of deforestation; ... | |
|
Timber exploitation: Clearing; selective felling; group felling; strip felling | |
|
Season extracted: dry season ; rainy season |
Table 2: Summary of agricultural production systems in Sub Saharan Africa (after Dixon et al, 2001)
Table 3: Summary statistics on each farming system
NOTES: sources et caractéristiques des données
1 --GLASOD, human induced soil degradation
2 --GAEZ cropland map (% of cropland extent, 5' cell resolution) (Fischer et al, 2002)
3 --GAEZ cropland map (% of cropland extent, 5' cell) and Global map of irrigated areas (% of areas equipped for irrigation, 5' cell) (Fischer et al, 2002)
4 --Livestock statistics and LANDSCAN 2002 population map (30"" cell resolution) (Landscan, 2002)
5 --GAEZ cropland map (% of cropland extent, 5' cell) and Landscan 2002 population map (number of inhabitants, 30" cell) (Fischer et al, 2002)(Landscan, 2002
6 --LANDSCAN 2002 population map (30"" cell resolution)"
7 --SRTM DEM (30""cell, Roads, Cities > 25 000 inhabitants)
8 --Chronic under nutrition among children (HfA index, 5' grid cell)
9 --CIESIN IMR, Number of deaths occurring in a population per year among infants in their first year of life (2.5' grid cell
Figure 1. Overview of the spatial data integration procedure.

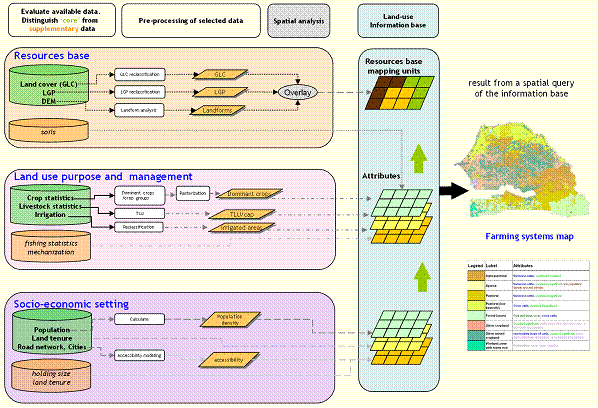
Figure 2. Decision tree classification of regional farming systems in sub Saharan Africa (from Dixon et al., 2001).
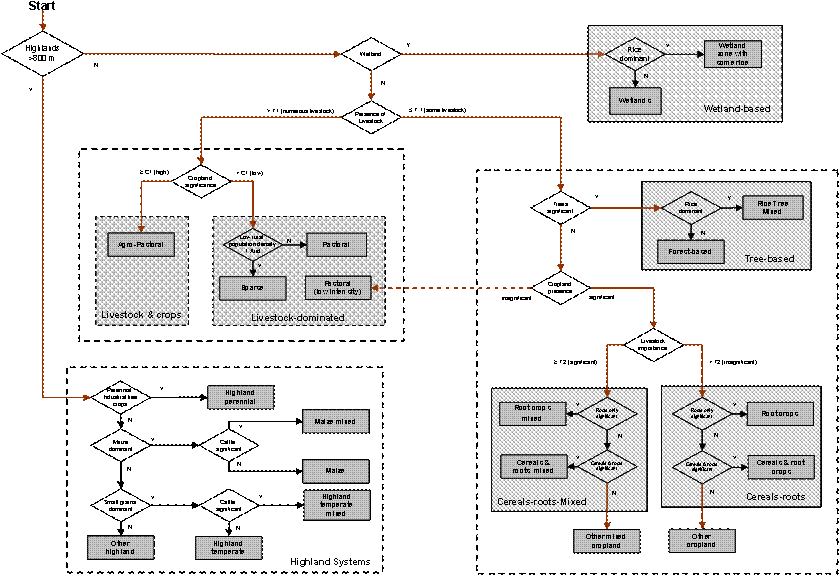
Figure 3. Map of the resources base
|

Figure 4 (a). Map of farming systems (this study).
|

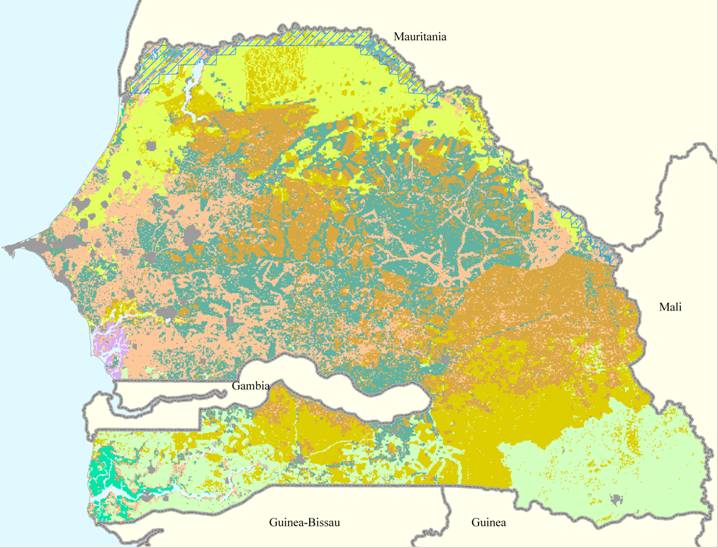

Figure 4 (b). Extract from regional farming systems map (Dixon et al, 2001)
|


|

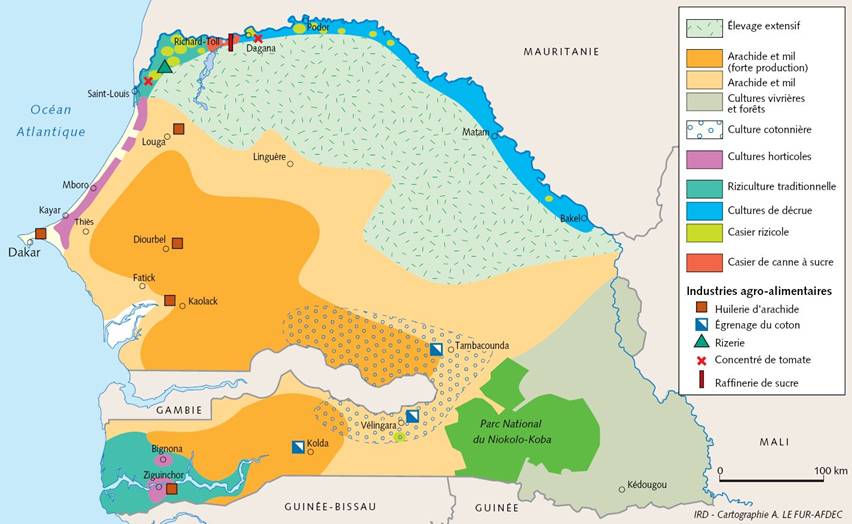

Figure 4 (d). Land use and land cover map (Tappan et al, 2004).
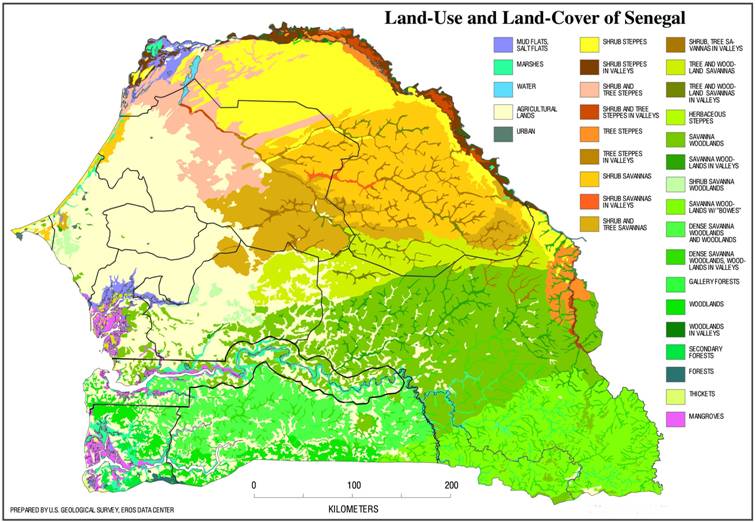

Figure 4 (e). Land use and land cover map (CSE, 2003).
|


[1] LADA – Land Degradation in Drylands (LADA, 2006).
[2] Land use concerns a wide range of activities undertaken by humans in order to obtain various products and services from land resources. Activities may therefore range from ‘extractive’ processes requiring essentially no inputs (e.g. hunting, gathering) to ‘productive’ processes requiring significant inputs and land management.
[3] Land cover (i.e. the observed biophysical cover on the earth’s surface) (FAO,2000)
[4] Several land uses can be associated with a single land cover type (e.g. grazed forests), also, a single land use can be associated with several land cover types.
[5] Comité permanent inter états de lutte contre la sécheresse au Sahel - CILSS
[6] A use of land defined in terms of a product, or products, the inputs and operations required to produce these products, and the socio-economic setting in which production is carried out (FAO, 1999).
[7] Similar in concept to ‘ecological zone’ – a land area, generally smaller than a region but considerably larger than a farm, with a definable combination of climate, relief, altitude, edaphic conditions and natural vegetation (FAO, 1999).
[8] Examples of land use classes illustrating differing socio-economic purposes: Conservation, Collection of plant and animal products, Forestry, Livestock, Crops, Fisheries, Recreation, Mineral extraction, Settlement, Security uses (after Young, 1998)
[9] Commodity groups: Cereals; Roots, tubers; Sugar crops; Pulses; Nuts; Oil-bearing crops; Vegetables; Fruits; Fibres of vegetal origin; Spices; Fodder crops and products; Stimulant crops; Tobacco, rubber and other crops (after FAO, 2006-a)
[10] Indicators may be chosen, for example, using the Pressure-State-Response (PSR) framework for the eventual formulation of interventions. P- pressures due to the use of the land (e.g. agricultural, industrial, social, economic and ecological pressures). S – condition of the benefits of land use (e.g. provisioning, regulating, cultural) at a point in time. R - management or societal response at various scales to improve situation (e.g. policies, instruments, laws, taxes,..).
[11] Similar in concept to land facet – ‘a land unit with climate, landforms, soils and vegetation characteristics which for most practical purposes may be considered as uniform’ (FAO, 1999)
[12] Similar in concept to Land management Unit - Land units suitable for the same type of use, with insufficient variation to warrant division into smaller units (FAO, 1999).
[13] E.g. types of boats, nets, level of motorization, location (lake, river, coast).